Introduction to the dashboard
Plausible Analytics is built with simplicity and speed in mind. There is no navigational menu. There are no additional sub-menus. There is no need to create custom reports. You get one simple and useful web analytics dashboard out of the box.
Rather than tracking every metric imaginable, many of them that you will never find a use for, Plausible Analytics focuses on the essential website stats only. It is easy to use and understand with no training or prior experience.
Here’s what you can discover on your Plausible dashboard. You can also explore our live demo where you can see the actual traffic of our website.
Top Graph
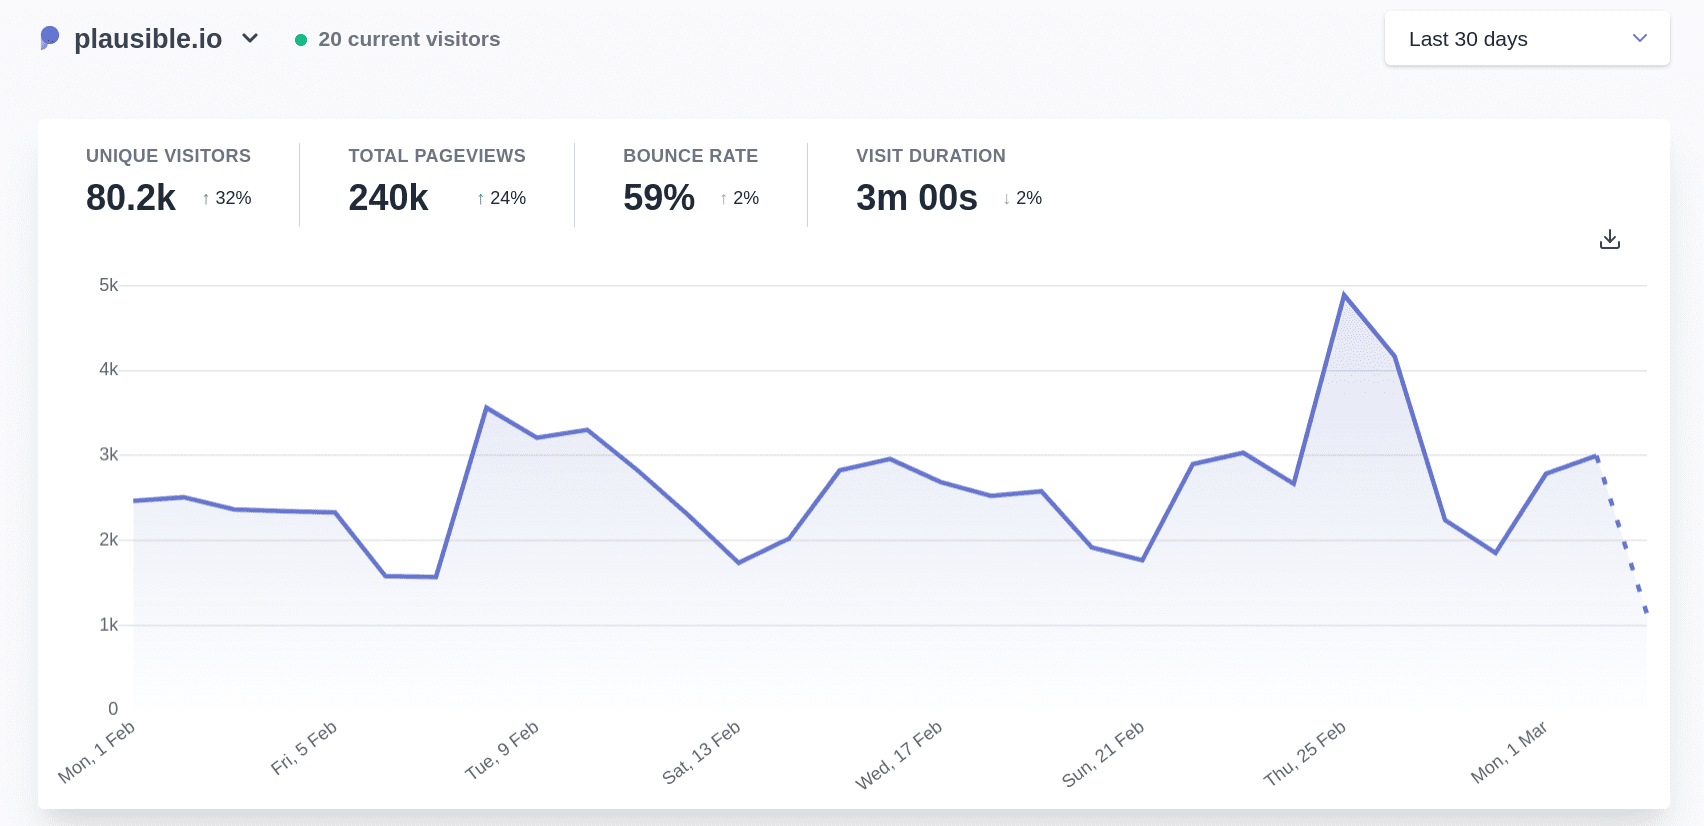
See the number of unique visitors, total page views, the bounce rate (the percentage of sessions that had one page view only) and the visit duration. These metrics include a percentage comparison to the previous time period, so you understand if the trends are going up or down.
Choose the time range that you want to analyze in the date picker in the top right. The visitor numbers are automatically presented on an hourly, daily, or monthly graph. The default time frame is set at the last 30 days.
By clicking on the number of "current visitors" (defined as those that visited the site in the last 5 minutes) or by selecting "Realtime" in the date picker in the top right, you can see the realtime dashboard that tells you what's happening on your site live in that moment.
The realtime dashboard also includes a pageview graph for the last 30 minutes. It is updated every 30 seconds so you don’t have to refresh it to stay up to date.
note
Click on your site name in the top left side of your dashboard. It allows you to select "Site Settings" in the dropdown menu but also switch to a different site you have added to your Plausible account.
We get all the favicons (your site favicon and the favicons of all the referral sources) directly from the DuckDuckGo API. We display the same icon that DuckDuckGo shows in their search results.
Top Sources
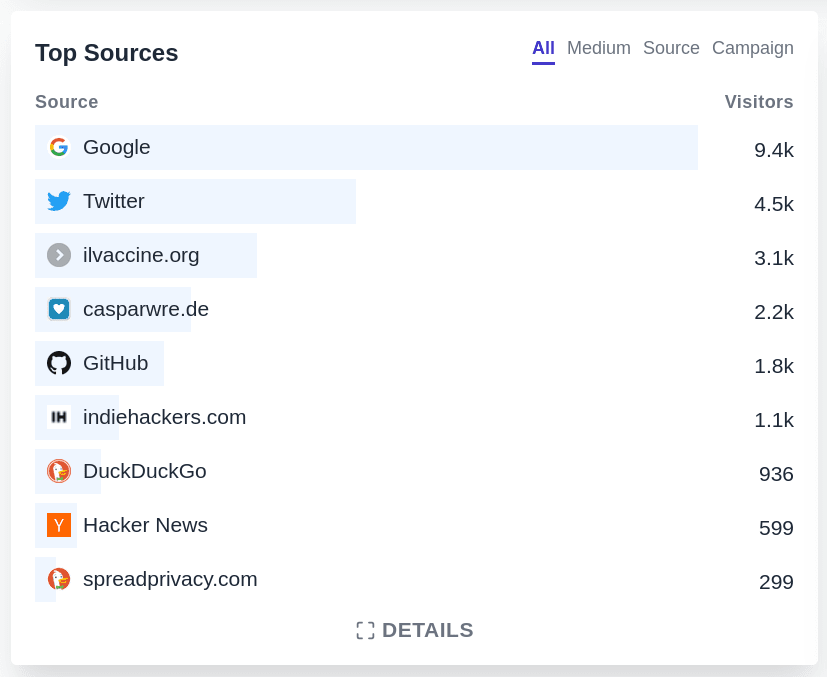
See all the top referral sources of traffic ranked by the number of unique visitors. You can click on the "details" button to see the full list which also includes the "Direct/None" traffic. Additional metrics such as bounce rates and visit duration of the individual referral are included too.
You can also see all the visitors coming from the UTM tagged links such as links in your emails, social media or in your paid campaigns. Click on the "Medium", "Source" and "Campaign" tabs on your top sources report to explore these. You can learn more about link tagging here.
Note that the referral sources including UTM and other query parameters are counted only when they start a new session on your site.
note
You can go granular and click on any of the metrics on your Plausible dashboard to filter the dashboard by it. You can mix and match filters too. For instance you can drill down to see traffic coming from a specific referral source to a specific page over time. Learn more about filtering here
Top Pages
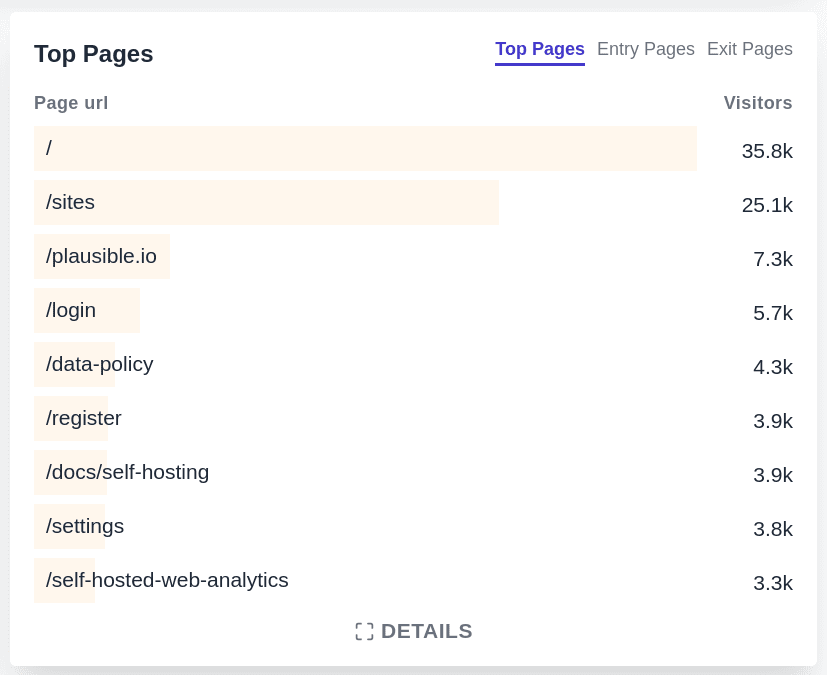
See all the most visited pages on your site ranked by the number of unique visitors. You can click on the "details" button to see the full list with additional metrics. The number of pageviews, bounce rate, and time on page for the individual pages are included too.
You can also get insights into the visitor flow by looking at the "Entry pages" and "Exit pages". Click on the "details" button to see the full list with additional metrics. For "Entry pages" details include visit duration for visits that started on a specific page and for "Exit pages" details include the exit rate percentage.
note
Looking for the definitions of the metrics you have access to? See this list.
Locations
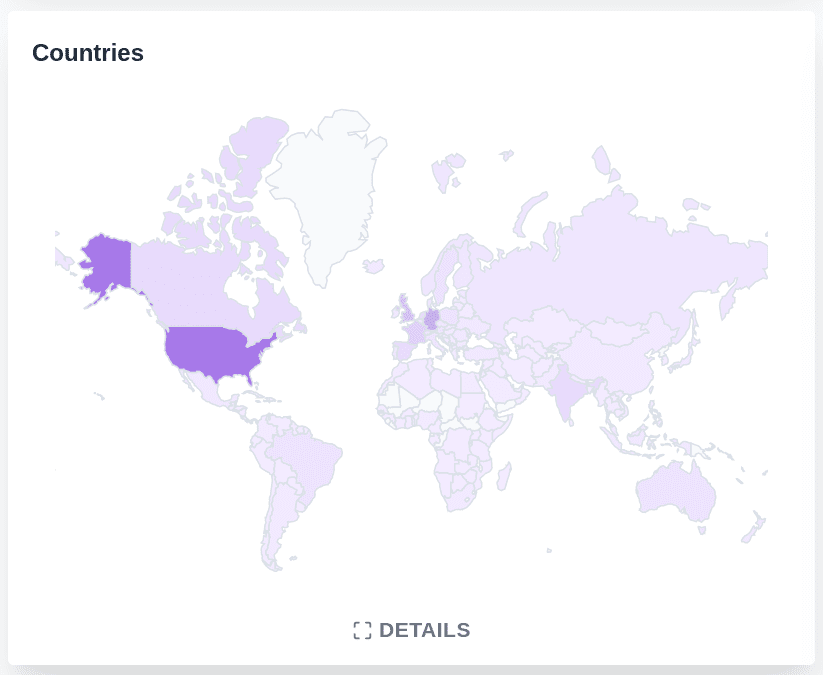
See the list of countries, regions and cities your traffic is coming from. You can click on the "details" button to see the full list ranked by the number of visitors.
note
Want a quicker way to navigate the dashboard? You can use the keyboard shortcuts to do so. Here's the full list of shortcuts we support.
Devices
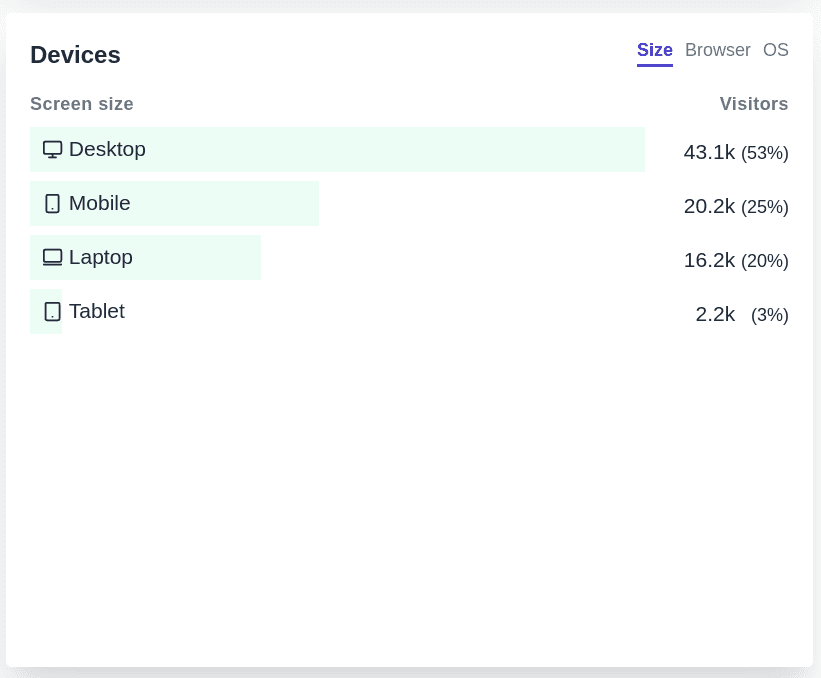
You can see the device, browser and operating system your visitors are using. Click on the individual browser or operating system to drill down and see browser versions and OS versions too.
Goal Conversions

Track events and goals to identify the number of unique converted visitors, the total number of conversions, the conversion rate, and the referral sites that send the traffic that converts the best. We have a very flexible support for goals which allows you to create your own metrics to collect and analyze data that Plausible doesn’t automatically track. Read more here.