Export your website stats
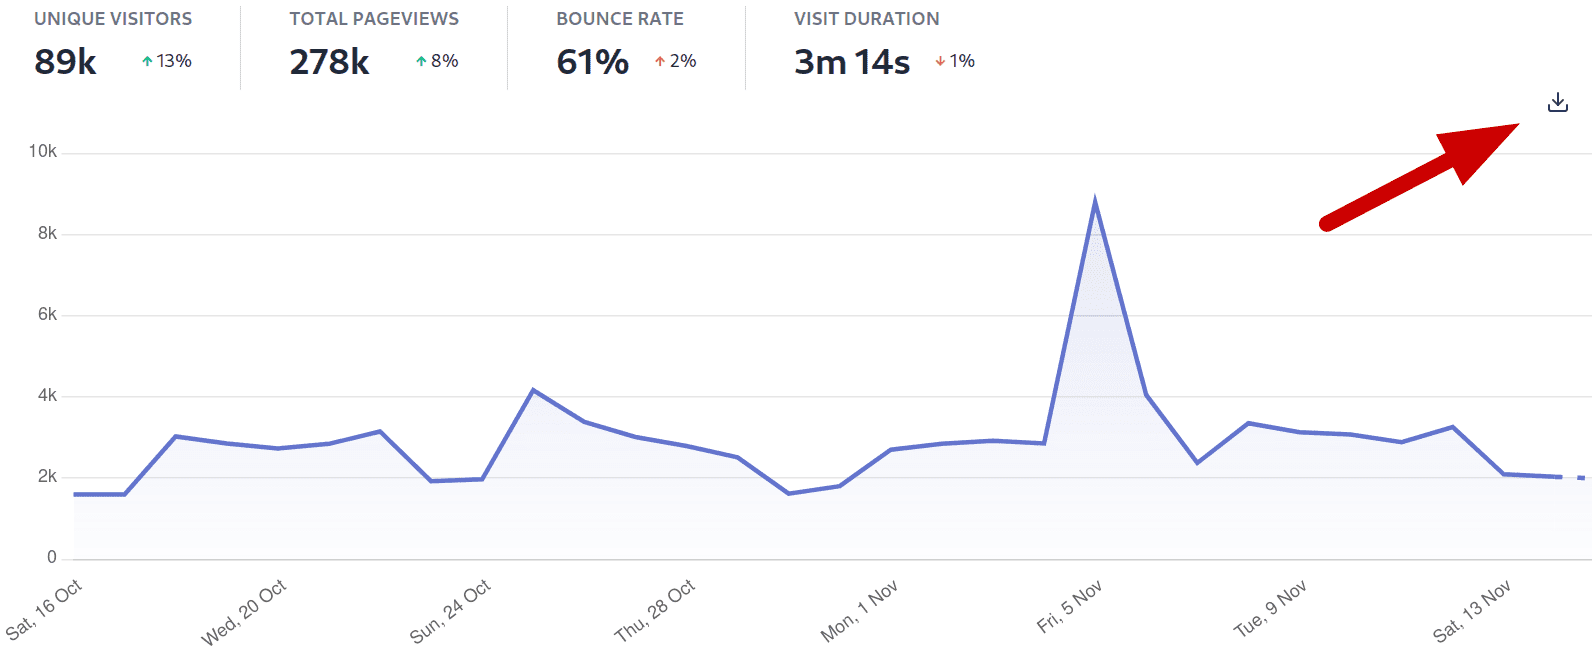
On the main chart on the top of your Plausible dashboard you can export your website stats.
Select the date range in the top right to view the specific time period. Then click on the "Download" icon on the right hand side of the main graph to download your stats.
You can even export a filtered view. Filter your dashboard by any metric and click on the download icon to get an export of that particular view. Segment the dashboard by any goal such as external link clicks, 404 error pages or custom events to download those metrics.

It will export a ZIP file which includes CSV files of the individual reports. You can then import your stats into Excel or other data analysis tools.
For example, visitors.csv exports the metrics from the top chart and includes daily stats for the number of visitors, the number of pageviews, bounce rate percentage and visit duration in seconds. The format is like this:
| Date | Visitors | Pageviews | Bounce Rate | Visit Duration |
|---|---|---|---|---|
| 2020-05-31 | 149 | 218 | 79 | 68 |
| 2020-06-01 | 140 | 194 | 83 | 52 |
| 2020-06-02 | 171 | 225 | 82 | 43 |
Note that the individual CSV files are limited to 300 entries each while page reports are limited to 100 entries each. If you want an even more granular way to export your stats, please take a look at our stats API.